After having a look at some data analysis tools, today I’m going share some resources about nerdy concepts that have helped me do better data science. What I present here is not always necessary to start working with data, but I will try to convince you that it is worth it.
No me gustaba restar ni dividir, así no más
Y me encantaba mirar las estrellas sin contarDi un giro de 180° grados
Gloria Trevi, “Matemáticas” (2022)
Y me encontré contigo de mi lado
Comprendí la ecuación, el universo se abrió
I have selected some resources that worked for me, which means they are likely to work for people who like to visualise and interact with mathematical concepts to make them less abstract. I also include a small section on good programming practices that, as a self-taught person, I wish I had learned earlier.
Regarding the level of the resources, they are chosen by a person who likes maths, who was not particularly good at maths exams, who had taken statistics in veterinary school, and who was very motivated to learn more about statistics and probability.
If you don’t have ten minutes to read this post, jump to the summary table. If you have zero minutes but want some recommendations: read the book An Introduction to Statistical Learning and use GitHub.
Statistics
I think the most enjoyable way to learn statistics is to watch Statquest videos. Need to brush up on your statistics basics? Check out this playlist. Want to understand linear models, machine learning or statistics in R? It’s all here. Feeling too grown-up to learn statistics with dinosaurs and little songs? Your loss.
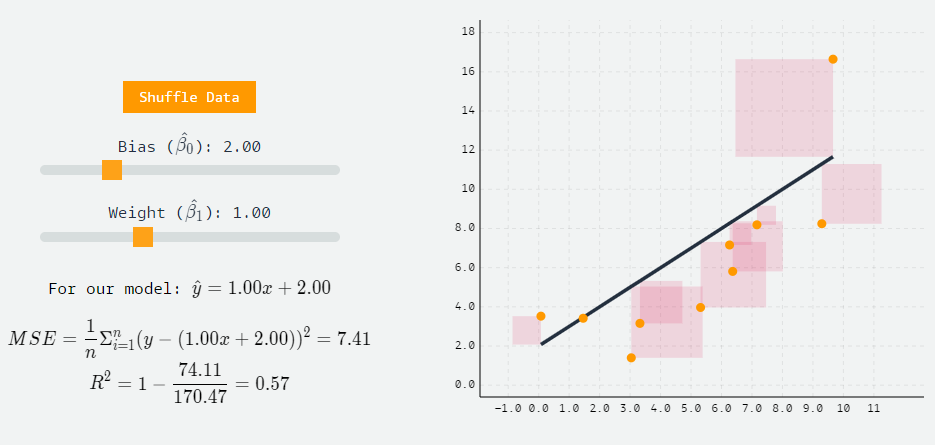
Other platform I find great for understanding machine learning concepts is MLU-EXPLAIN. All their articles are interactive lessons and visual works of art, but in particular, if you are going to do any statistics in your life, their article on linear regression is something you should read (and play with).
If I had to recommend one and only one resource to get serious about data science, modelling and statistics, it would be An Introduction to Statistical Learning. It’s open, free, brilliantly written, comprehensive, and complements theoretical explanations with practical exercises in R or Python.
Just as a warning, so-called “introductory” books on statistics and mathematics can easily run to 600 pages. Which are worth it! But I don’t want anyone to panic when they download it. This book assumes that you already know some statistics at undergraduate level in a non-mathematical degree. That is, it expects that you understand what a mean or a standard deviation is, but it doesn’t expect you to be experienced in matrix calculations.
This book also has an edX course, where you can find the content explained in videos. To go further, by the same authors, check out the book The Elements of Statistical Learning.
Probability
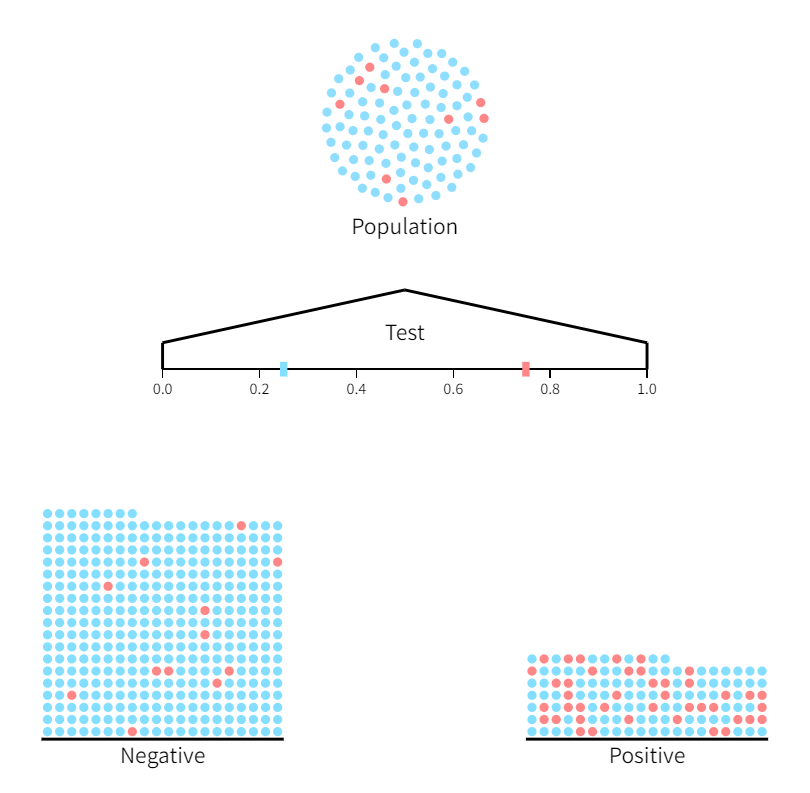
A nice, interactive and free course for a brush-up on probability concepts is Brown University’s Seeing Theory: a visual introduction to probability and statistics.
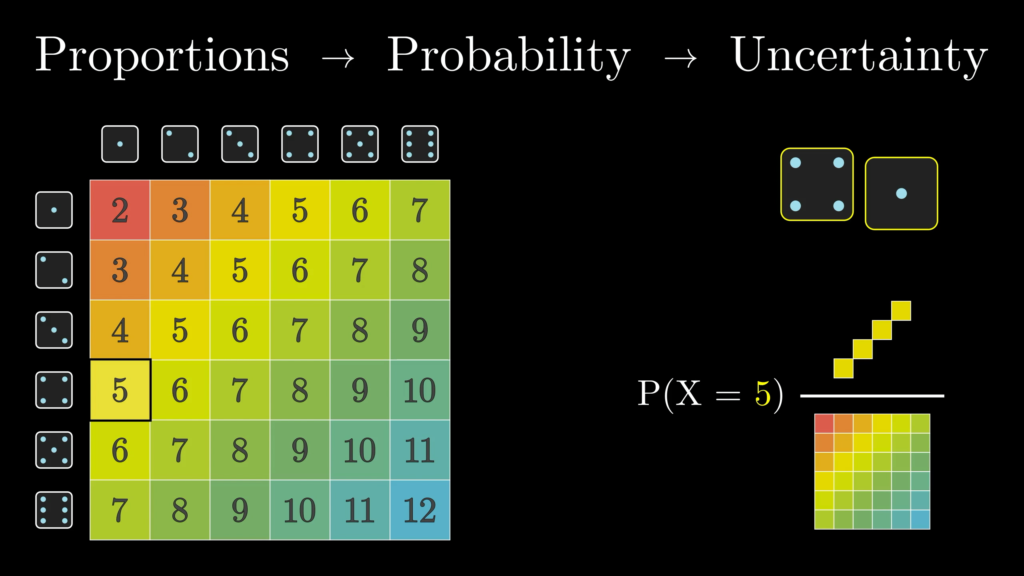
To take it a step further, I recommend 3Blue1Brown’s Probability series. It covers many probability topics that you will need for statistics, such as the central limit theorem, binomial probability or Bayes’ theorem. I also recommend 3Blue1Brown for any other mathematics topic, they make videos for learning mathematics with very clear visualisations and it is one of my favourite sites on the internet.
To learn how to work with probability in R, I have used the R Data Science Probability course and its counterpart textbook.
Miscellaneous maths
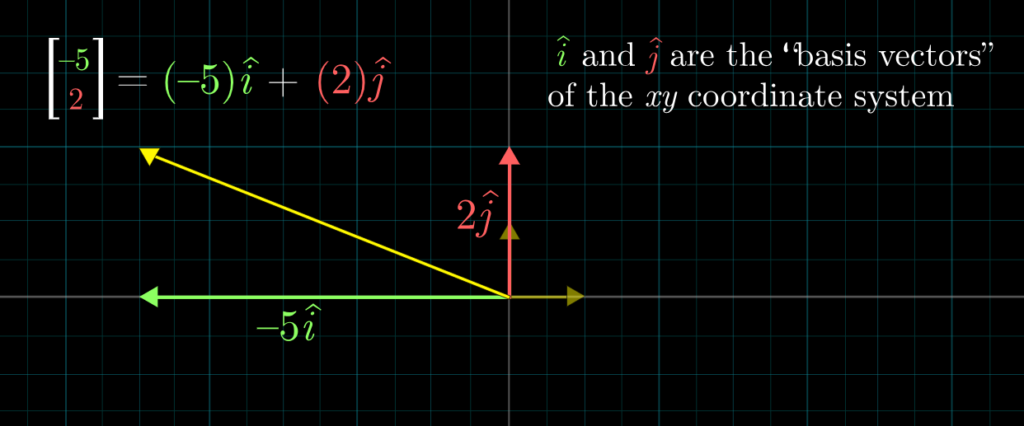
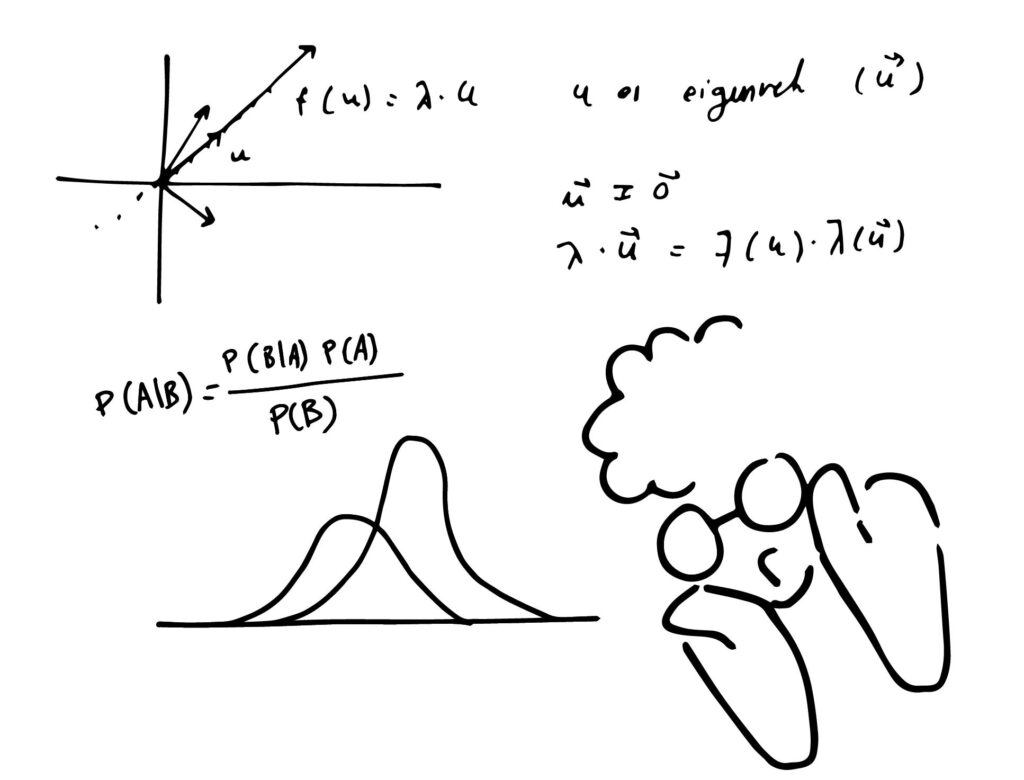
One of the mathematics lessons that has probably had the biggest impact on my current way of thinking about matrix data (which you will come across frequently), was the 3Blue1Brown Linear Algebra series. I think my life changed forever the moment I finally understood what an eigenvector was. After understanding some linear algebra with those videos, I sometimes use Interactive Linear Algebra by Dan Margalit and Joseph Rabinoff to review concepts in a more classical format.
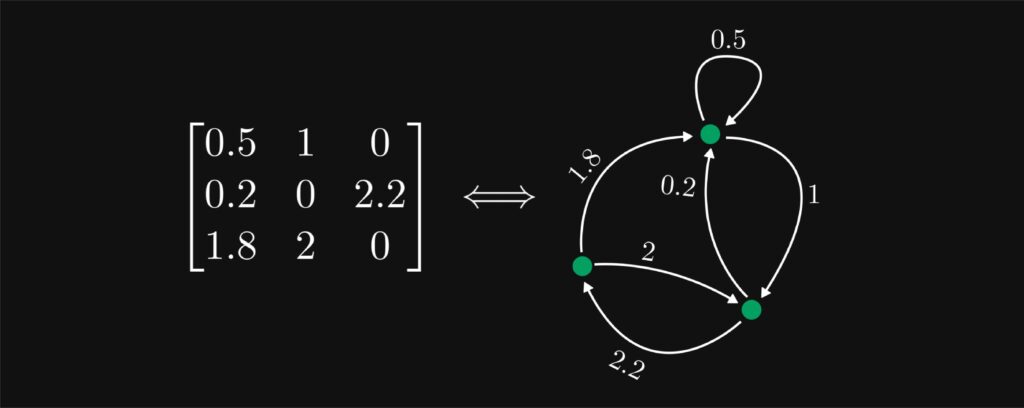
These lessons go hand in hand with the Pelindrome article “Matrices are graphs and graphs are matrices“. This article helped me to rethink some aspects of linear algebra as graph/network analysis, which I find way more intuitive than matrices. If you like working with networks, you will probably find the interactive D3 Graph Theory project interesting.
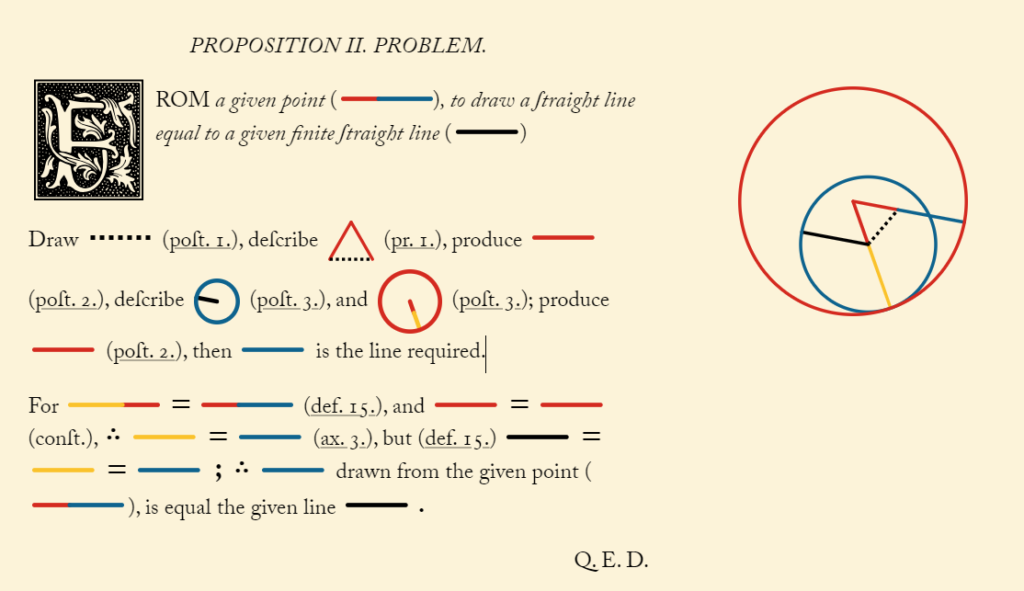
Finally, I would like to recommend a website that has nothing to do with data analysis, but which I think can change the way you think about the presentation of mathematical information: Byrne’s Euclid. In this site, Nicholas Rougeux has compiled the books of Euclid’s Elements with coloured diagrams and symbols and interactive diagrams, based on the work of Oliver Byrne (1847).
Good programming practices
For me, the most important thing to keep in mind when you start programming for data analysis is that it is super important to write code that is readable and understandable by humans. This includes following a consistent code style, using self-explanatory and consistent names, and documenting the code with comments in the human language of your choice. I usually choose English because the absence of accents and other special characters prevents me from having encoding problems.
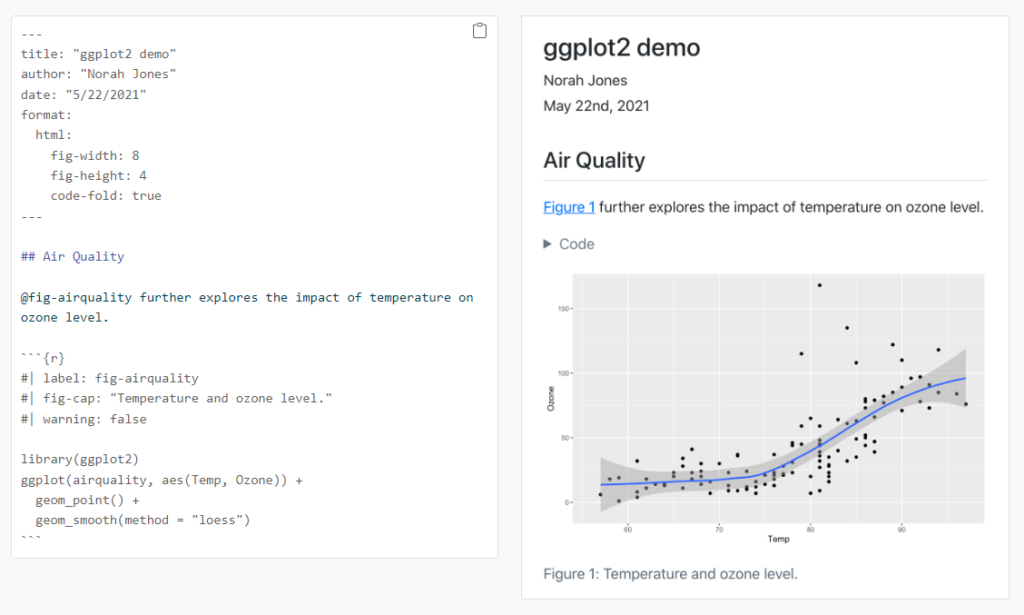
Code notebooks, such as Jupyter, Rmarkdown or Quarto (my favourite), can be useful for explaining and reproducing the analysis process. Code notebooks are documents that combine markdown (formatted text), executable code blocks, and other outputs (such as graphs, tables and LaTex equations).
To document larger projects, you can consider writing a manual and using flowcharts to describe the project’s files and processes.
Using a version control system like git and tools like GitHub is a lifesaver. It can help track changes, restore previous versions, check what’s been done and what’s left. It is essential if you have several people working on the same code, but even if you are working alone, it is great for project management and backups. I learned how to implement this in Rstudio using Happy Git and GitHub for the useR.
In addition, learning debugging, testing, and optimisation techniques is important for more advanced projects. The introduction to a book that gave me an idea of the importance of good software engineering in scientific research was “Software Engineering for Science” by SE4Science. On a practical level for R, I recommend the books Mastering Software Development in R and Advanced R.
Summary
Not everyone needs a lot of statistics, mathematics and programming to be able to work with their data. But knowing quite a bit about it will always help you work better. And if you’re like me, you might find it pretty cool to learn.
In this table you will find some resources to help you understand statistics, probability and other mathematical concepts, as well as resources for writing well-documented code and using version control tools.
This post is part of the series “Getting into data science“.
You can subscribe if you’d like to receive by email the posts I write when I’m not PhD-ing 😊. At least that’s how it’s supposed to work, this is the first time a post is being notified, if you’re on the mailing list I hope this newsletter finds you well!