Bit by bit, I’m gonna get my bricks out in the sticks
Mother Mother, “Bit by Bit” (2012)
Bit by bit, I’m gonna build my house in the wildest thickets
You may need skills in data analysis because you already have data to work with. Or you may need data because you have to practice your data analysis skills. In this final post in the Getting into data science series, we will focus on the second case: You are looking for data to play with. But even if you are already working with real data, I strongly recommend that you take a look at some nice databases to learn what data should look like to make your life easier.
Here I will give a brief introduction to what data tables, databases, APIs and their documentation are, and a list of some databases that I have found to be great for practice.
As always, if you have less than ten minutes, you can jump to the summary.
What can you find when you search for data?
Beginners, listen to this: if you want to avoid a lot of frustration before you see any progress, practice with clean, well-documented data tables. Here are some concepts that can help you when searching for data.
Data tables
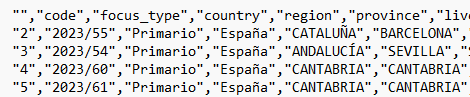
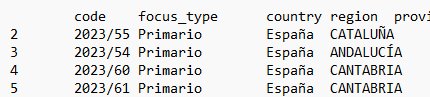
A data table is a structured way of organizing and presenting data in rows and columns. It allows for easy comparison, sorting, and analysis of data. When data is stored in a data table, it can also be called tabular data. There are many tabular text formats that can be used to store “pure” tabular data, some of the most common ones are: comma-separated values (csv)1, tab-separated values (tsv) and generic tabular data (dat).
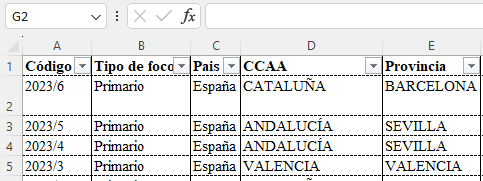
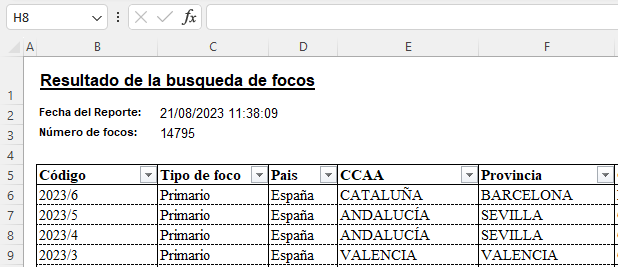
Tables are not the only way to store data. Data can also be stored in spreadsheet formats such as Excel. Spreadsheets look like tables because they are organised like a matrix (with rows, columns and sheets) and can contain tables, but they are not the same. Spreadsheets are more versatile, they can contain several tables along with other elements that are not tables, such as text, visual formatting, charts, and they can perform complex calculations.
Other data formats
Several statistical software formats are widely used in data analysis, such as SPSS database transport (.sav), Stata database transport (.dta), R data serialisation (.Rds) and R data (.Rdata).
More flexible, non-tabular data formats include JSON, which is used to store data objects consisting of attribute-value pairs and arrays, and can store data in a ‘nested list’ format. Another format in which you can find data (but if you are a data analyst and not an engineer or developer, you would rather not) is XML. It’s a meta-markup language and we won’t go into it.
Clean data
A clean data table is a well-organised, error-free and properly documented dataset. What exactly this means may change depending on your particular context. I can guarantee that a lot of open data is not clean.
Although there are many ways to clean and standardise data, a very useful and widely used system is R’s Tidy system, explained by Hadley Wickham in R for Data Science.
There are three interrelated rules that make a dataset Tidy:
- Each variable is a column; each column is a variable.
- Each observation is a row; each row is an observation.
- Each value is a cell; each cell is a single value.
You could break these rules and still work efficiently, but being systematic pays off in the long run. If you get used to working with data in this way, and you learn to transform any table into Tidy format, your life working with data will be happier.
Databases
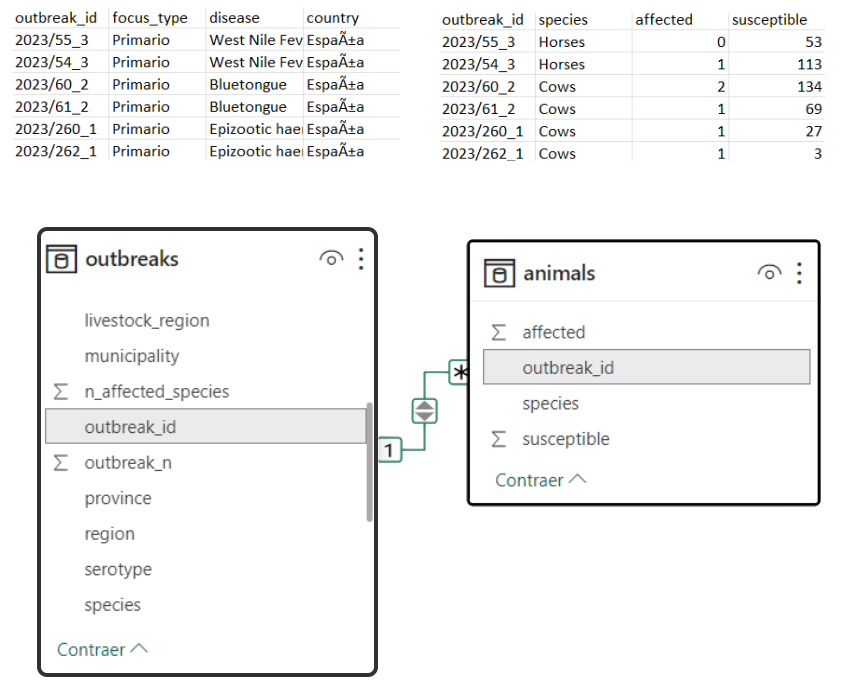
A database is a structured collection of data that is organised and stored in a way that allows efficient retrieval, updating and management of data. A database may be composed of several data tables (or non-tabular data), which may be related to each other. When a database has several related data tables, it is called a relational database. These relationships are usually based on keys. A key is usually a unique identifier for a row in a database.
Although the concept may be fairly straightforward, databases are a dense topic that I won’t explore further in this post, but you can read a bit more about them in the article Basic Database Concepts article from Geeks for Geeks.
How to access data?
Whatever the format or complexity of the data, you probably want to end up with one table that you can use to create summaries, statistical analyses and visualisations. There are several ways to get to that table. Tedious manual entry, copying and pasting data from a document, and downloading data files are probably the easier way to get data. Some useful tools to save time in this process are Table Capture, an extension for getting tables from the web, and Microsoft Excel’s Insert data from picture options. To import your final table to R, read Data Import in R for Data Science.
However, in data science, the what we need to analyse cannot always be formatted as a static table. Sometimes the data is too big, so we need to filter exactly what we need before retrieving a simple table (e.g. by date, country…), other times the data is too fast and we need to retrieve it periodically to update our analysis.
If you want to automate your workflow or to access complex databases, APIs can be very useful. An API (Application Programming Interface) allows different software applications to communicate and interact with each other. This means that your code can access the functionality of another application, for example to retrieve data from Spotify, Web of Science, or the WHO. These are examples of public APIs, that any developer can use. If you have your own data in a database management system (e.g. Oracle, MySQL, AWS, Microsoft Azure…), it will also have an API, but it is likely to be private. To learn how to use APIs in R, I recommend the chapter on Accessing Web APIs in the book Technical Foundations of Informatics, and to learn how to connect to private databases read the chapter on Databases in R for Data Science.
For recurrent data retrieval, an API is always the best possible scenario, but if an API is not available, there is Plan B: web scraping. Web scraping consists of automatically downloading and navigating a web using a bot to copy data from the site. However, it requires some knowledge of HTML and often has limitations due to the anti-bot measures often implemented on sites. It also has some legal issues that you should be aware of. For more information about copying data from the web using rvest R package, see the Web Scraping chapter in R for Data Science.
Data documentation
Data does not always come with good documentation, but it should 😠. If you maintain a database of any kind, write documentation for it. If you use open data and it has documentation, consult it. Someone has spent their time saving your time, let them hold your hand and guide you in accessing and using their data.
Data documentation provides the contextual information needed to understand, access and reuse data. For example, in research, data documentation should include the methodology by which the data were collected or transformed, and any information needed to ensure the transparency and reproducibility of the research. At a higher level, database documentation provides information about the database structure, available tables, relationships and query instructions. In addition to technical metadata, good documentation includes human-readable explanations of the meaning of each table and its variables.
Where to find data?
One of my biggest recommendations for finding fresh, clean and properly documented data is the Data is Plural weekly newsletter of interesting datasets.
I have also compiled a list of nice databases that are well documented, easy to access and that you can use for practice. Note: as this selection is based on my experience, it is rather biased towards health and EU related sources.
- Our World in Data: Poverty, disease, hunger, climate change, war and inequality research data
- FAO: Global food and agriculture data
- WHO: Global health data
- WAHIS: Global animal health reference database of the World Organisation for Animal Health (WOAH)
- EFSA: EU data on food consumption, biological hazards and contaminants
- ECDC: EU data on infectious diseases
- World Bank: Global development data
- OECD: Economic data of the Organization for Economic Cooperation and Development members
- ICPSR: Social and behavioural science research data
You can also find many ready-to-use datasets on Kaggle (community data science platform), on the R datasets package, or simply by searching for a country’s open data platform on google (e.g. Spain’s data catalogue). Google is developing a database search tool, but so far I don’t think it is easy to use it to find specific data, or to find the best sources.
And finally, there is one type of data that I would recommend exploring even to someone who does not want to get into data science: personal data. Remember that thanks to the current General Data Protection Regulation, you have the right to request access to your data from any company or organisation that holds data about you. This means that Spotify, Goodreads, Facebook or Google have to offer users the chance to download their own data. It’s a little scary to see how much data is stored about you, but analysing your own data can help you understand this data-driven world, and if you’re a fan of Spotify Wrapped, you can create your own personalised version.
Summary
What can you find when searching for data?
Data tables are structured ways of organizing data in rows and columns. Spreadsheets can contain multiple data tables along with other elements such as text, visual formatting, and charts. Databases are structured collections of data that enable efficient retrieval and management. Non-tabular data formats are less commonly used in regular data analysis. Resources: Clean data, Basic Database Concepts.
How to access data?
In addition to manually copying and pasting data or downloading files, there are strategies to automate workflows or access complex databases. Some databases can be accessed via APIs, which allow different software applications to communicate and interact with each other. Another method to automatically retrieve data from the web is web scraping. Resources (for R): APIs, Database access, Web scraping
Where to find data?
Resources: Data is Plural, Our World in Data, FAO, WHO, WAHIS, EFSA, ECDC, World Bank, OECD, ICPSR, Kaggle, R datasets, Google Data Search, personal data from companies
This post is part of the series “Getting into data science“.
Now that the introduction to data series is over, I’ll get back to data visualisation (and some epidemiology) in the next post. Subscribe to be notified!🌻
- Comma-separated means semicolon-separated if the region set on your computer uses commas to separate decimal numbers. ↩︎