![[Experimental]](figures/lifecycle-experimental.svg)
Creates a ggplot2 visualisation of Monte Carlo node data showing distributions as semi-transparent boxplots overlaid with scatter points representing individual uncertainty iterations.
Usage
mc_plot(
  mcmodule = NULL,
  mc_name = NULL,
  mcnode = NULL,
  data = NULL,
  keys_names = NULL,
  color_by = NULL,
  order_by = NULL,
  group_by = NULL,
  filter = NULL,
  threshold = NULL,
  scale = NULL,
  max_dots = 300,
  point_alpha = 0.4,
  boxplot_alpha = 0.3,
  color_pal = NULL
)
Arguments
- mcmodule
(mcmodule object, optional). Module containing the node.
- mc_name
(character, optional). Name of the mcnode in the module.
- mcnode
(mcnode object, optional). mcnode to plot directly.
- data
(data frame, optional). Input data. If NULL, extracted from
mcmodule. Default: NULL.- keys_names
(character vector, optional). Column names for grouping variates. If NULL, uses node keys from module or row indices. Default: NULL.
- color_by
(character, optional). Column name to colour points and boxplot. Must be in
keys_namesordata. Default: NULL.- order_by
(character, optional). Column name or "median" to reorder y-axis groups. If "median", groups ordered by median value. Default: NULL.
- group_by
(character, optional). Column name to group variates (e.g., "commodity"). Variates organised so all scenarios per group appear together. Default: NULL.
- filter
(expression, optional). Unquoted expression to filter variates (e.g.,
pathogen == "a"ororigin == "nord"). Passed totidy_mcnode(). Default: NULL.- threshold
(numeric, optional). Reference value for vertical dashed line. Default: NULL.
- scale
(character, optional). Transformation for x-axis: "identity" (default), "log10", "log", "sqrt", or "asinh". Default: NULL.
- max_dots
(integer). Maximum dots per variate; exceeding this triggers representative sampling. Boxplots always use all simulations. Default: 300.
- point_alpha
(numeric). Transparency for points (0–1). Default: 0.4.
- boxplot_alpha
(numeric). Transparency for boxplots (0–1). Default: 0.3.
- color_pal
(character vector, optional). Named vector of colours for
color_bycategories. Default: NULL.
Details
When color_by is NULL, scenarios are coloured by default:
— baseline scenario (scenario_id == "0"): blue (#6ABDEB);
— alternative scenarios: green (#A4CF96).
Boxplots show all uncertainty iterations for statistical accuracy;
scatter points are sampled to improve readability with many variates.
Examples
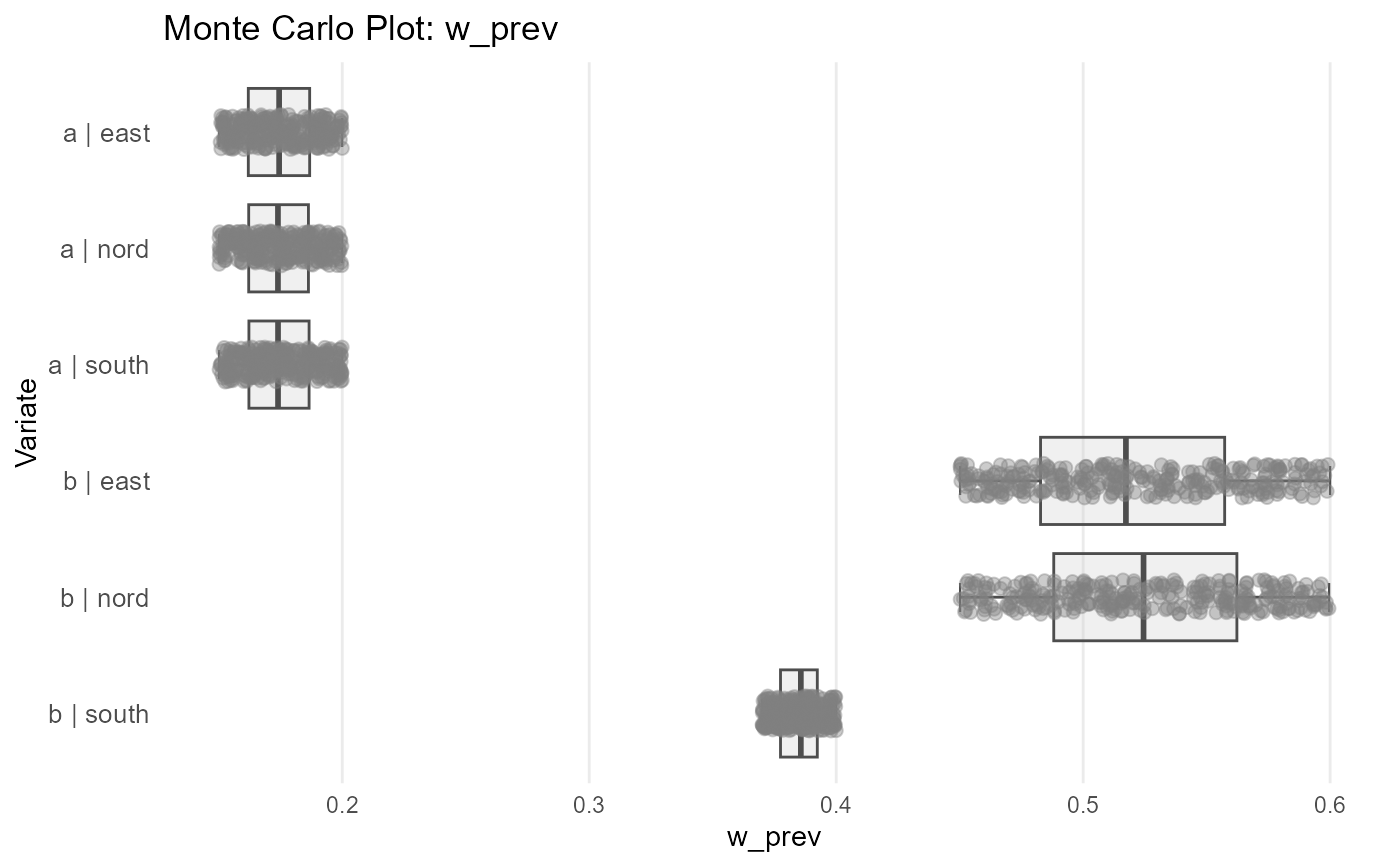
# Basic plot using mcmodule and mc_name
mc_plot(imports_mcmodule, "w_prev")
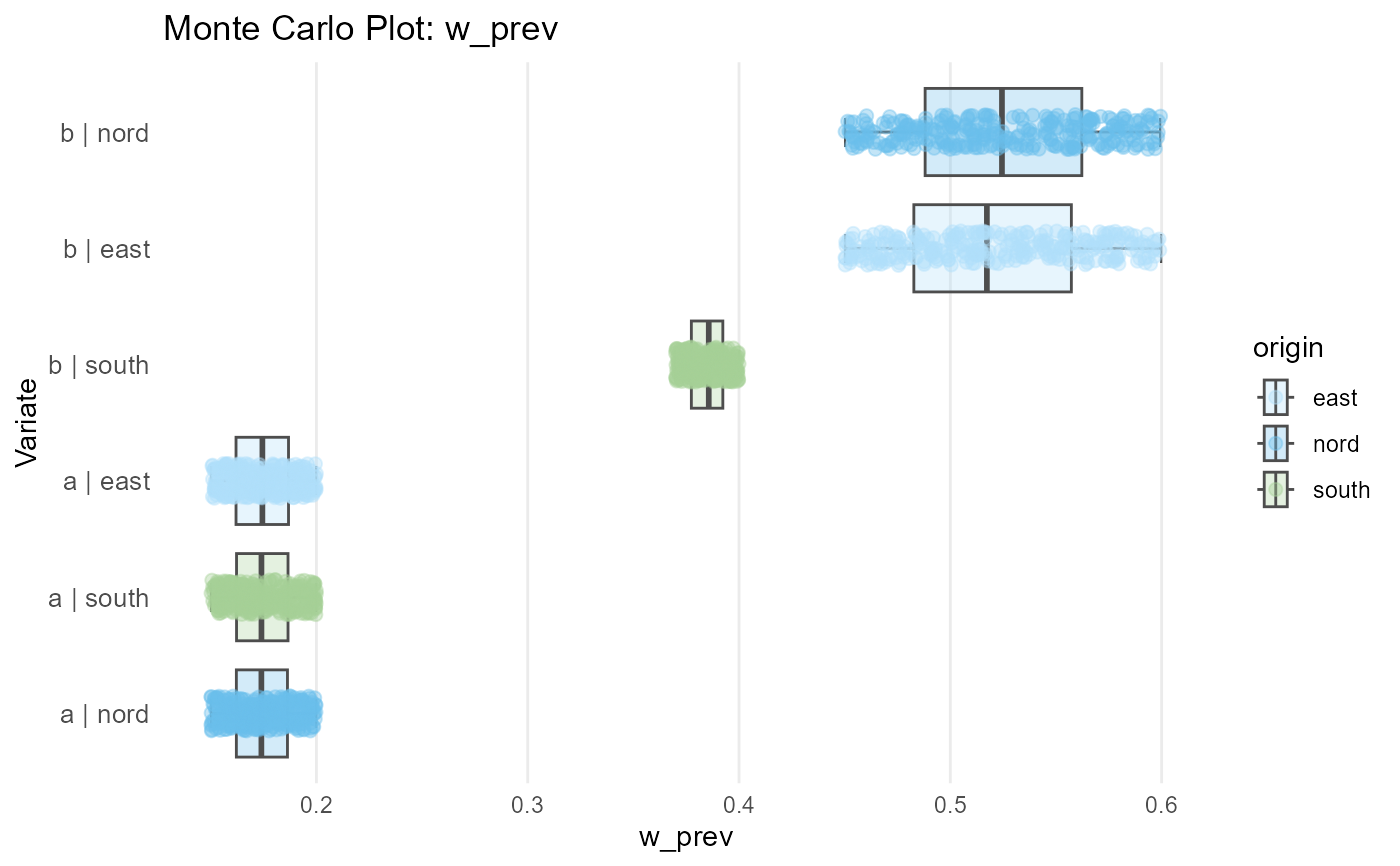
 # Plot with custom coloring and ordering
mc_plot(imports_mcmodule, "w_prev",
color_by = "origin",
order_by = "median"
)
# Plot with custom coloring and ordering
mc_plot(imports_mcmodule, "w_prev",
color_by = "origin",
order_by = "median"
)
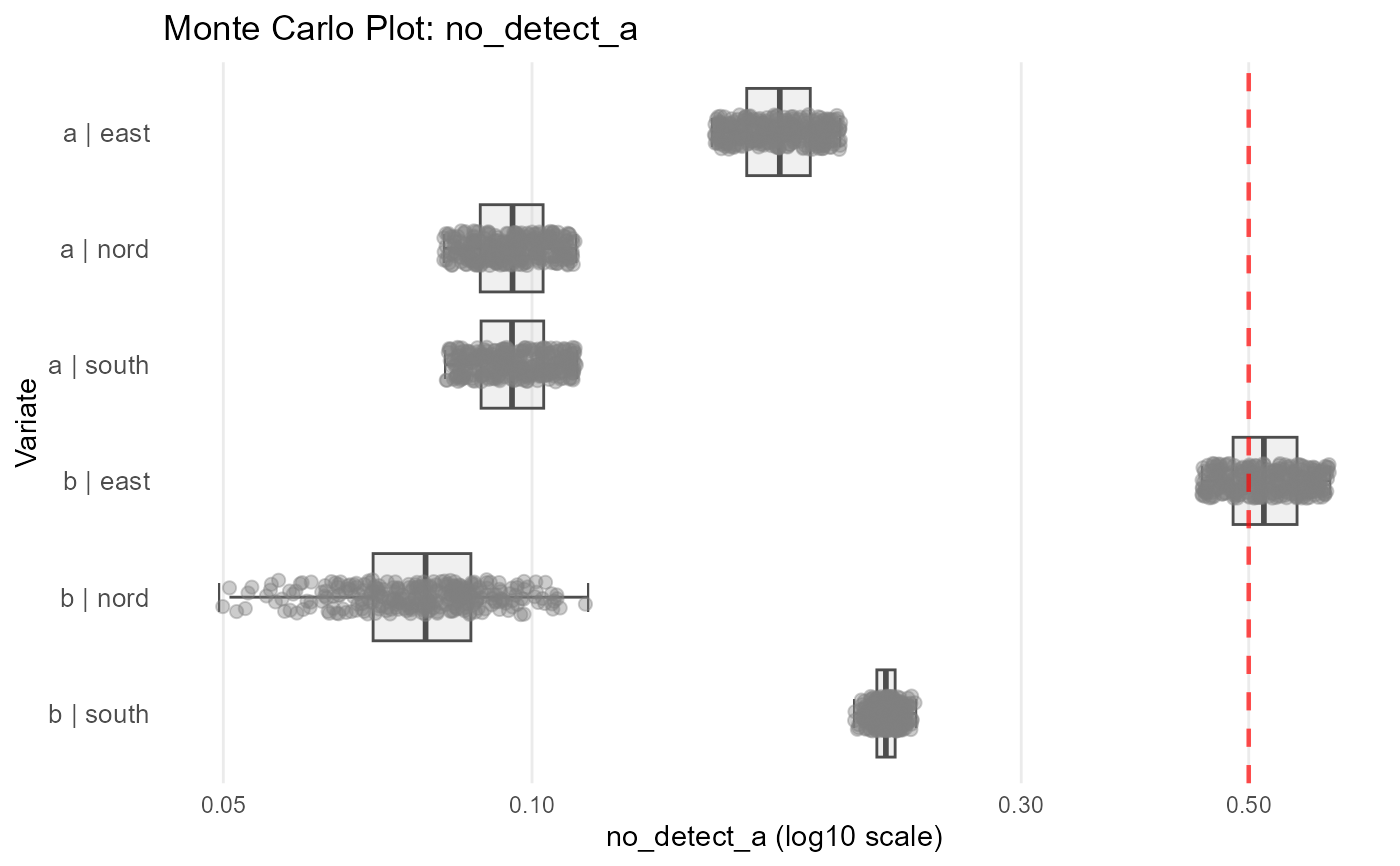
 # Plot with threshold and scale transformation
mc_plot(imports_mcmodule, "no_detect",
threshold = 0.5,
scale = "log10"
)
# Plot with threshold and scale transformation
mc_plot(imports_mcmodule, "no_detect",
threshold = 0.5,
scale = "log10"
)