This post series is for anyone who’s ever asked me about the world of data analysis, who wants to be a bit more nerdy and go beyond Excel.
Don’t analyse, don’t analyse
The Cranberries, “Analyse” (2001)
Don’t go that way, don’t live that way
I’ve put together my favourite free and open data science resources on general data analysis, mathematics, statistics and R programming. To make it a bit more digestible, I have split it into three posts:
- Know your tools: A look at some data analysis tools and resources to get you started
- Get nerdy: Navigate the disciplines behind data science: mathematics, statistics and programming
- Find data and play: Databases you can use to practise if you do not have a data project to start with
Whether you find this compilation useful or not, I recommend that you spend some time identifying how you like to learn. Searching for training can be overwhelming with the amount of resources available today. I think it’s a good idea to take a look at different types of resources and figure out what works best for you before you dive in.
If you have less than six minutes, jump to the summary table.
Excel
Excel is not the ideal tool for analysing large data sets, or for analysing small data sets in a reproducible way. But if you work with data, you cannot get away from Excel, so you need to know at least a little bit about it.
![[A tower of blocks is shown. The upper half consists of many tiny blocks balanced on top of one another to form smaller towers, labeled:]
All modern digital infrastructure
[The blocks rest on larger blocks lower down in the image, finally on a single large block. This is balanced on top of a set of blocks on the left, and on the right, a single tiny block placed on its side. That block is Excel]](https://nataliaciria.com/wp-content/uploads/2023/09/dependency_excel-554x1024.png)
If you have never used Excel before, you might consider starting with a beginner’s course, but if you are somewhat familiar with the interface and want to start analysing data, I would recommend spending a few hours reviewing some core concepts of Excel:
- Read this page on the overview of formulas and the A1 reference system
- Practice how to use “COUNTIF“, “SUMIF“, “XLOOKUP“, “IF“, “UNIQUE” and “FILTER“.
- Learn about conditional formatting and basic charts.
Microsoft’s help and training centre has good explanations, videos and exercises to practice with these functions. If you get confident with them you will probably be able to cope with many excel tasks. If you are already familiar with these concepts, then I think you are ready to move on to other data analysis tools.
R
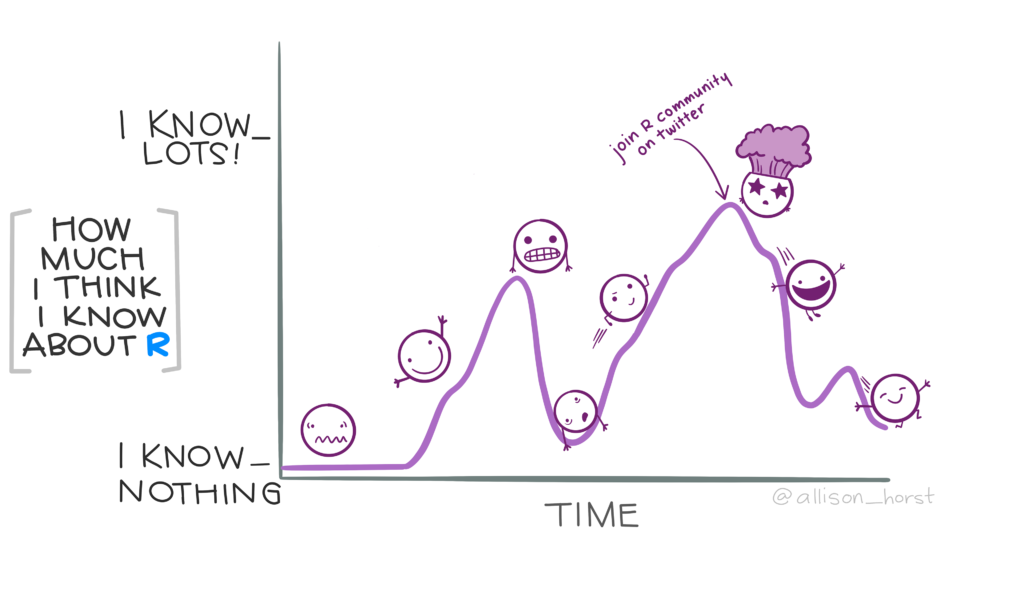
R is a really nice and tidy language for working with data. If you are going to focus on tabular, descriptive and statistical data analysis, learning R is a great option. For the record, I’m not focusing on R because I think it’s the best tool, but because it’s the one I use, and at this point I love both the language and its community.

To get get started with R, I took the first two courses of the HarvardX Data Science Professional Certificate. I still recommend it. It is based on video lessons combined with DataCamp exercises, and it is “free” if you do it on the assigned time. In addition to the course, I recommend the two free books by the lecturer of this course, Rafael A. Irizarry:
- Introduction to Data Science (2019) introduces you to the R interface, data wrangling and visualisation, and shows you how to work with R to do automated and reproducible work.
- Advanced Data Science (2019) covers statistics, probability and machine learning.
DataCamp is a site you should know about if you want to learn data analysis. I have only taken a few of their courses or short tutorials, but if I were to start coding today, I would choose their Data Scientist track. The Google Data Analytics Professional Certificate is another way to start from scratch and become a data analytics pro.
My favourite book on data analysis is R for Data Science, by Hadley Wickham, Mine Çetinkaya-Rundel, and Garrett Grolemund. It focuses on the tidyverse, which has fans and detractors, but for me it’s a super useful tool to do clear, clean, elegant data analysis. As the creators of the tidyverse say in their collection of learning resources, it is worth looking at their cheat sheets (I’m a big fan of these super short and visual guides. I keep them on paper, always on my desk).
Finally, two resources that are very useful for learning specific tasks in R, without having to create an account, and that allow you to practice code directly online:
- Posit interactive tutorials created using the learnr package
- W3Schools R short interactive tutorials
And last, but probably most important, copy and paste every question and error into google to find the programmers’ forum where your answer is discussed.
Python
Python is a high-level, general-purpose programming language. I program in R because the people around me program in R (it usually makes sense to learn the most common programming language in your field), but Python is also very powerful for data analysis and, in some ways, more flexible than R. I won’t go into detail about Python resources because I don’t use it (yet), but many of the platforms mentioned previously for R have Python equivalents:
- Data Scientist with Python Certification in Data Camp
- Google Advanced Data Analytics Professional Certificate in Coursera
- W3Schools Python interactive tutorials
One of the reasons I am interested in learning Python is that it currently has more tools for deep learning. One of the courses recommended by my Python friends is the Deep Learning Specialiced Programme in Coursera.
SQL
Structured Query Language (SQL) is a language used in programming to manage data in relational database systems. This is one of the topics I’ve been picking up lately as I’ve realised that I need to use SQL a lot to deal with big data. SQL is an important part of the Google Data Analytics Professional Certificate, and this is probably how I will approach it. To learn just SQL, DataCamp’s SQL Fundamentals course seems a good place to start.
PowerBi
PowerBi is an data analysis service by Microsoft oriented to create interactive dashboards. For me, PowerBi is one of the tools with the most interesting trade-off between difficulty and usefulness. It requires a paid licence for sharing and publishing, but all the data analysis can be done with the desktop version for free.
It requires data literacy but not programming skills. The use of formulas is more like Excel than a programming language. The first few steps can be a bit frustrating as it has a very particular interface and workflow, but if you start with simple projects you can quickly see progress.
I may go into detail about PowerBi and other data visualisation platforms such as Infogram, Tableau, Flourish and Datawraper in another post. However, what I want to highlight here about Power BI is not its data visualisation capabilities, but its benefits for exploring and analysing large and complex data sets without coding.
I don’t recommend it as your primary tool for working with data, especially if you’re in science, because it’s not as easy to do transparent and reproducible analysis as in R or Python. However, it is a very useful tool for exploring new data before writing your analysis scripts .
Some resources for getting started with PowerBi:
- Getting Started with the Power BI Desktop 5-minute video.
- Microsoft Learning Platform PowerBI Introduction and Data Shaping tutorial.
- For hands-on practice: Dimensional model report tutorial and covid-19 dashboard example.
For an example of exploratory analysis with Power BI, see the RASVE dashboard post.
Summary
There are a lot of tools out there for working with data, the tools are evolving rapidly, and the best way to get started is to figure out what you want to learn data analysis for.

For some inspiration, here is a table of the tools and resources that have worked best for me:
You can subscribe to the blog updates to be notified when the next post is published, and if you miss anything or would like to contribute to this list of resources, you can write to mail@nataliaciria.com 🙂